Crypto交易信号机器人实现
在本文中,我将告诉你如何构建一个能够监控多个加密货币交易所并每小时生成数十甚至数百个加密货币信号的信号机器人。
一键发币: x402兼容 | Aptos | X Layer | SUI | SOL | BNB | ETH | BASE | ARB | OP | Polygon | Avalanche
在本文中,我将告诉你如何构建一个能够监控多个加密货币交易所并每小时生成数十甚至数百个加密货币信号的信号机器人。
免责声明
我必须提醒你,加密货币信号并不是赚钱的终极工具,它们可以帮助你在正确的时间做出正确的交易,但不要完全信任它们。有时它们有效,有时无效,使用你的判断。
你可以在Github找到源代码,点击这里访问带有工作机器人的Telegram群组。
1、它能做什么
信号机器人从这些加密货币交易所获取数据:
- Binance
- Binance Futures
- OKEX
- OKEX Swap
- Bybit
- Bybit Perpetual
- MEXC
- MEXC Futures
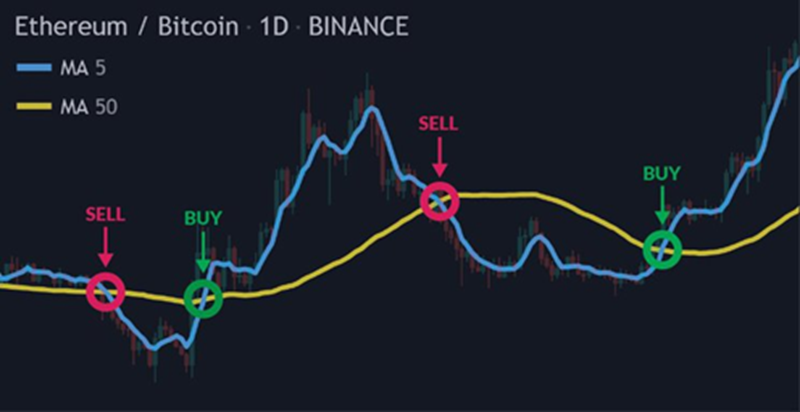
然后它使用一些流行的的技术指标分析来自2500多个交易对的市场数据。时间框架是1小时和4小时(根据指标而定)。以下是这些指标:
- RSI(相对强弱指数)
- 随机震荡指标
- MACD(移动平均收敛发散)
- 趋势(使用线性回归)
- 技术模式(经典的K线图模式,如头肩顶、双顶/双底和三角形)
- 拉高出货(寻找极端的价格上涨或下跌)
- 高成交量(寻找极端的高成交量)
并从这些指标的组合中创建信号,例如:
- RSI + 随机震荡指标
- 技术模式 + 趋势
- 拉高出货 + 趋势等
我总共找到了11种可以转化为有用信号的指标组合。
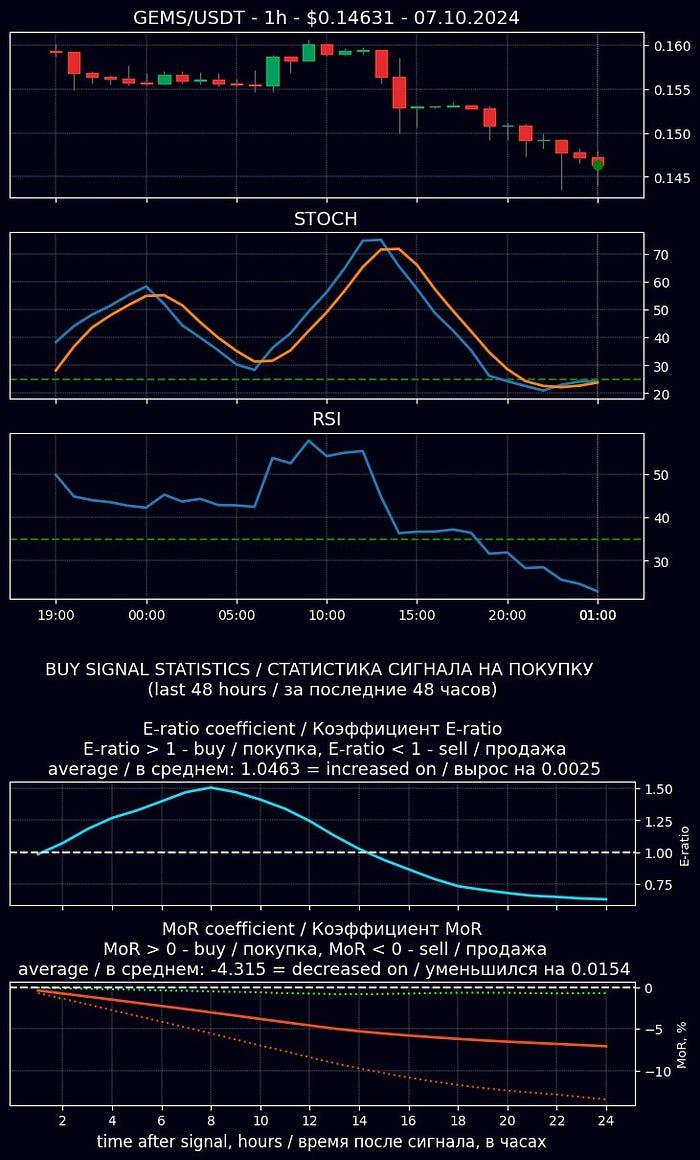
然后它计算该信号的一些统计信息,并将结果发送到Telegram频道。信号看起来像这样:
可选功能是自动化ML交易模块,该模块接收信号,使用ML模型分析其潜在收益,如果收益相当高,则在相应的交易所下交易订单。我不会在这篇文章中描述ML模型的工作原理,因为它可能会变得很长。我会在下一篇文章中介绍这一点。
2、它是如何工作的
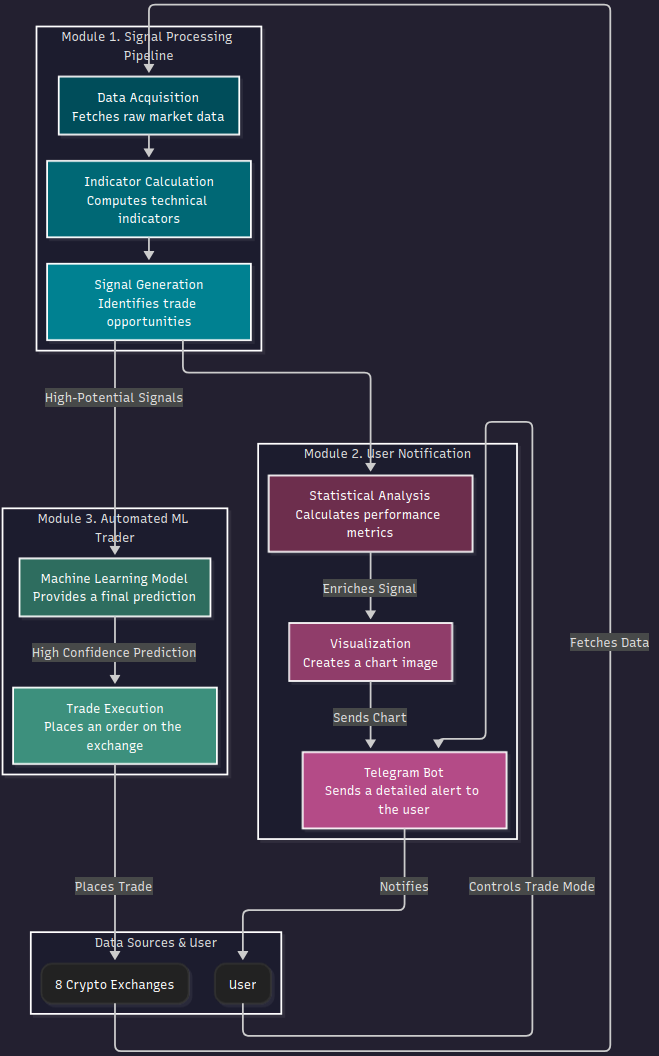
该项目由3个模块组成。
3.1 信号处理管道
a. 从所有交易所获取数据
这里是获取Binance数据的模块代码示例。它还删除了一些重复的交易对(例如BTC/USDT,BTC/USDC,BTC/BUSD):
"""
This module provides functionality for interacting with the Binance cryptocurrency
exchange API. It defines the `Binance` class, which extends the `ApiBase` class to
retrieve and manipulate market data such as ticker symbols, K-line (candlestick)
data, and historical data for specified intervals.
"""

from datetime import datetime
from typing import List, Tuple, Union

import pandas as pd
from binance.client import Client

from api.api_base import ApiBase

class Binance(ApiBase):
    """Class for accessing Binance cryptocurrency exchange API"""

    client: Client = ""

    def __init__(self, api_key: Union[str, None] = None, api_secret: Union[str, None] = None):
        """
        Initialize the Binance API connection.

        Parameters
        ----------
        api_key : str, optional
            The API key for the Binance account.
        api_secret : str, optional
            The API secret for the Binance account.
        """
        if api_key is not None and api_secret is not None:
            self.connect_to_api(api_key, api_secret)
        else:
            self.api_key = api_key
            self.api_secret = api_secret

    def connect_to_api(self, api_key: str, api_secret: str):
        """
        Connect to the Binance API using the provided credentials.

        Parameters
        ----------
        api_key : str
            The API key for the Binance account.
        api_secret : str
            The API secret for the Binance account.
        """
        self.api_key = api_key
        self.api_secret = api_secret
        self.client = Client(self.api_key, api_secret)

    @staticmethod
    def delete_duplicate_symbols(symbols: pd.Series) -> list:
        """
        Remove duplicate symbols where pairs with USDT exist
        and delete the corresponding BUSD pairs.

        Parameters
        ----------
        symbols : pd.Series
            A series of cryptocurrency symbols.

        Returns
        -------
        list
            A list of filtered symbols without duplicates
            (BUSD pairs removed if USDT exists).
        """
        filtered_symbols = []
        symbols = symbols.to_list()

        for symbol in symbols:
            if symbol.endswith("BUSD"):
                prefix = symbol[:-4]
                if prefix + "USDT" not in symbols:
                    filtered_symbols.append(symbol)
            else:
                filtered_symbols.append(symbol)
        return filtered_symbols

    def get_ticker_names(self, min_volume: float) -> Tuple[List[str], List[float], List[str]]:
        """
        Get ticker symbols and their corresponding volumes,
        filtering by a minimum volume.

        Parameters
        ----------
        min_volume : float
            The minimum volume to filter tickers.

        Returns
        -------
        tuple of lists
            A tuple containing:
            - A list of filtered symbols.
            - A list of their respective volumes.
            - A list of all symbols before filtering.
        """
        tickers = pd.DataFrame(self.client.get_ticker())
        all_tickers = tickers["symbol"].to_list()

        tickers = tickers[
            (tickers["symbol"].str.endswith("USDT")) | (tickers["symbol"].str.endswith("BUSD"))
        ]
        tickers.loc[:, "quoteVolume"] = tickers.loc[:, "quoteVolume"].astype(float)
        tickers = tickers[tickers["quoteVolume"] >= min_volume // 2]

        filtered_symbols = self.check_symbols(tickers["symbol"])
        tickers = tickers[tickers["symbol"].isin(filtered_symbols)]
        filtered_symbols = self.delete_duplicate_symbols(tickers["symbol"])
        tickers = tickers[tickers["symbol"].isin(filtered_symbols)].reset_index(drop=True)

        return tickers["symbol"].to_list(), tickers["volume"].to_list(), all_tickers

    def get_klines(self, symbol: str, interval: str, limit: int) -> pd.DataFrame:
        """
        Retrieve K-line (candlestick) data for a given symbol and interval.

        Parameters
        ----------
        symbol : str
            The symbol of the cryptocurrency (e.g., 'BTCUSDT').
        interval : str
            The interval for the K-lines (e.g., '1h', '1d').
        limit : int
            The maximum number of data points to retrieve.

        Returns
        -------
        pd.DataFrame
            DataFrame containing time, open, high, low, close, and volume
            for the specified symbol.
        """
        tickers = pd.DataFrame(
            self.client.get_klines(symbol=symbol, interval=interval, limit=limit)
        )
        tickers = tickers.rename(
            {0: "time", 1: "open", 2: "high", 3: "low", 4: "close", 7: "volume"}, axis=1
        )
        return tickers[["time", "open", "high", "low", "close", "volume"]]
b. 处理它们,计算指标
这是使用ta-lib库计算RSI指标的示例
"""
This module provides various technical indicators for analyzing financial data.
It defines an abstract base class `Indicator` and multiple concrete classes
representing specific indicators such as RSI, MACD, STOCH, ATR, and others.
Each indicator class is designed to calculate and append its respective indicator
values to a given DataFrame of financial data. The `IndicatorFactory` class is
responsible for dynamically selecting and returning the appropriate indicator
class based on the provided input.
"""

import warnings

import numpy as np
import pandas as pd
import talib as ta

warnings.simplefilter(action="ignore", category=FutureWarning)

class RSI(Indicator):
    """RSI indicator, default settings: timeperiod: 14"""

    name = "RSI"

    def get_indicator(self, df, ticker: str, timeframe: str, data_qty: int, *args) -> pd.DataFrame:
        """
        Calculate RSI indicator and append to DataFrame.

        Parameters
        ----------
        df : pd.DataFrame
            Input DataFrame with candlestick data.
        ticker : str
            Ticker symbol.
        timeframe : str
            Timeframe for data (e.g., 5m, 1H, 4H, 1D).
        data_qty : int
            The number of the most recent data to return.

        Returns
        -------
        pd.DataFrame
            DataFrame with calculated RSI values.
        """
        # if mean close price value is too small, RSI indicator can become zero,
        # so we should increase it to at least 1e-4
        try:
            if df["close"].mean() < 1e-4:
                multiplier = int(1e-4 / df["close"].mean()) + 1
                rsi = ta.RSI(df["close"] * multiplier, **self.configs)
            else:
                rsi = ta.RSI(df["close"], **self.configs)
        except BaseException:  # noqa
            rsi = 0
        df["rsi"] = rsi
        return df
c. 从指标组合中创建信号
这是它的代码。
class FindSignal:
    """
    Class for searching of the indicator combination

    Attributes
    ----------
    ttype : str
        The type of trade ('buy' or 'sell').
    configs : dict
        Configuration parameters including indicators, patterns, and timeframes.
    """

    def __init__(self, ttype, configs):
        self.ttype = ttype
        self.configs = configs
        self.indicator_list = configs["Indicator_list"]
        self.indicator_signals = self.prepare_indicator_signals()
        self.patterns = configs["Patterns"]
        self.work_timeframe = configs["Timeframes"]["work_timeframe"]
        self.higher_timeframe = configs["Timeframes"]["higher_timeframe"]
        self.timeframe_div = configs["Data"]["Basic"]["params"]["timeframe_div"]

    def prepare_indicator_signals(self) -> List[SignalBase]:
        """
        Prepare all indicator signal classes.

        Returns
        -------
        list
            A list of initialized indicator signal objects.
        """
        indicator_signals = []
        for indicator in self.indicator_list:
            if (indicator == "HighVolume" and self.ttype == "sell") or indicator == "ATR":
                continue
            indicator_signals.append(SignalFactory.factory(indicator, self.ttype, self.configs))
        return indicator_signals

    def find_signal(  # pylint: disable=R0912
        self,
        dfs: dict,
        ticker: str,
        timeframe: str,
        data_qty: int,
        data_qty_higher: int,
    ) -> List[List]:
        """
        Search for the signals through the dataframe, if found -
        add its index and trade type to the list.
        If dataset was updated - don't search through the whole dataset,
        only through updated part.

        Parameters
        ----------
        dfs : dict
            A dictionary containing dataframes for different tickers and timeframes.
        ticker : str
            The ticker symbol for the asset.
        timeframe : str
            The timeframe for the signals to be searched.
        data_qty : int
            The quantity of data to consider for finding signals.
        data_qty_higher : int
            The quantity of data from the higher timeframe to consider.

        Returns
        -------
        list
            A list of detected trading signals including
            their respective indexes and metadata.
        """
        points: List[List] = []

        try:
            if self.ttype == "buy":
                df_work = dfs[ticker][self.work_timeframe]["data"]["buy"].copy()
            else:
                df_work = dfs[ticker][self.work_timeframe]["data"]["sell"].copy()
        except KeyError:
            return points

        sig_patterns = [p.copy() for p in self.patterns]
        timeframe_ratio = int(
            self.timeframe_div[self.higher_timeframe] / self.timeframe_div[self.work_timeframe]
        )
        # Create signal point df for each indicator
        # merge higher dataframe timestamps and working dataframe
        # timestamps in one dataframe
        trade_points = pd.DataFrame()
        # Fill signal point df with signals from indicators
        for indicator_signal in self.indicator_signals:
            # if indicators work with higher timeframe -
            # we should treat them differently
            if indicator_signal.name == "Trend":
                if "linear_reg_angle" not in df_work.columns:
                    return points
                fs = indicator_signal.find_signal(df_work)
            elif indicator_signal.name == "MACD":
                # check higher timeframe signals every hour
                if data_qty_higher > 1:
                    if "macdsignal" not in df_work.columns:
                        return points
                    fs = indicator_signal.find_signal(df_work, timeframe_ratio)
                else:
                    fs = np.zeros(df_work.shape[0])
            else:
                fs = indicator_signal.find_signal(df_work)

            trade_points[indicator_signal.name] = fs

        # If any pattern has all 1 - add corresponding point as a signal
        for pattern in sig_patterns:
            # find indexes of trade points
            if self.ttype == "sell" and pattern == ["HighVolume"]:
                continue
            # check if pattern has all 1
            pattern_points = trade_points[pattern]
            max_shape = pattern_points.shape[1]
            pattern_points = pattern_points.sum(axis=1)
            # get trade indexes
            trade_indexes = pattern_points[pattern_points == max_shape].index
            # save only recent trade indexes
            trade_indexes = trade_indexes[df_work.shape[0] - trade_indexes < data_qty]
            sig_pattern = "_".join(pattern)
            points += [
                [
                    ticker,
                    self.work_timeframe,
                    index,
                    self.ttype,
                    df_work.loc[index, "time"],
                    sig_pattern,
                    [],
                    [],
                    [],
                    0,
                ]
                for index in trade_indexes
            ]
        return points
信号创建代码看起来相当复杂,让我解释一下它做了什么。它接受一个包含交易对数据的pandas DataFrame(列中有价格数据,如“high”、“low”、“open”、“close”,以及成交量和时间戳)和之前指标模块添加到这个DataFrame中的指标数据。如果某个时间点的指标值被认为是活跃的,那么它会被标记为1,否则为0。因此,如果组合中的所有指标在某个时间点都有值1,这意味着我们有一个信号。例如,如果RSI和STOCH列的值为1,这意味着我们有一个信号RSI_STOCH:
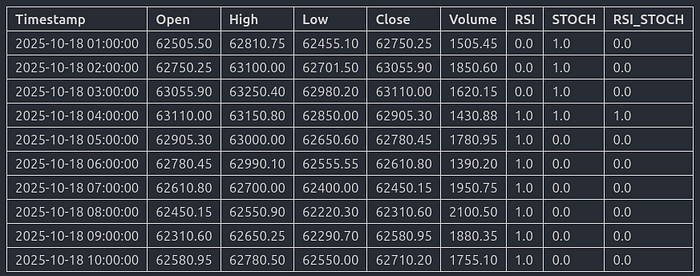
这就是它的样子,我们在2025年10月18日早上4点发现了RSI_STOCH信号。
3.2 用户通知模块
a. 计算过去24-96小时(取决于信号)每种信号类型的统计信息。机器人计算两个关键指标:
- E-ratio(边缘比率):这是一个衡量价格偏移的指标,计算方式为最大有利移动(MFE)除以最大不利移动(MAE):E-ratio = MFE/MAE。E-ratio大于1表明,历史上类似的信号更倾向于朝有利方向移动而不是相反方向。E-ratio小于1则表示相反。
- MoR(回报率):这个系数显示当前价格与信号时刻价格之间的平均百分比差异,历史上的类似信号。为了避免尖锐价格波动带来的噪音,这两个价格都使用30周期的移动平均进行平滑处理。
我从TurtleTrader一书中获取了这些统计数据,它们为交易者提供了定量优势,帮助他们评估历史表现和潜在风险回报。
b. 使用matplotlib从以前的数据中创建图表图像。这里没有什么特别的,只是大量的样板代码来创建一个看起来不错的图表图像。
c. 使用Python-Telegram-Bot将数据发送到Telegram频道。除了图片之外,还添加了更多有用的信息(交易类型:买入或卖出,可以购买/出售该交易对的加密货币交易所,TradingView的链接,当前价格等)。
3.3 自动化ML交易者
- 使用ML模型(LightGBM)预测信号的有用性
- 如果信号被认为是有用的——就在相应的交易对上放置一个订单
这个模型是否盈利?嗯,这取决于情况。有时候是,有时候不是,市场是一个高度随机的,这里进行预测是非常复杂的。我会在下一篇文章中介绍这个模型以及训练和推理过程。
4、底层技术
关键目录包括:
- bot: 机器人的主要逻辑,将不同的模块联系在一起
- api: 包含与各种交易所API交互的包装器。每个交易所都有自己的专用文件
- indicators: 这里存放所有技术指标的计算逻辑
- signals: 负责将指标组合起来生成最终的交易信号
- signal_stat: 包含收集信号统计信息的模块
- ml: 这个文件夹包含机器学习组件,包括LightGBM模型、推理逻辑和数据准备脚本
- config: 一个灵活的配置系统,允许根据环境的不同设置机器人的不同设置、信号和指标
- telegram_api: 从它的名字可以看出——它包含通过Telegram发送信号的逻辑
- visualiser: 包含生成信号图像的模块
机器人使用Docker,因此你可以轻松地启动它。
5、附加说明
这个机器人可以快速找到信号,但不是很快速。这是因为它处理的加密货币交易所和交易对数量非常巨大,需要一些时间来收集所有必要的信息。我一开始并没有设定目标去构建一个快速的机器人,也不认为这样做是好的,除非你在交易公司工作。如果你不这么做——你将无法与那些雇佣了数十名高素质程序员和数学家的交易公司竞争。所以主要的想法是构建一个交易助手,向交易者发送有用的信号,然后交易者考虑这个信号并做出交易决策。
免责声明:本站资源仅用于学习目的,也不应被视为投资建议,读者在采取任何行动之前应自行研究并对自己的决定承担全部责任。