Bitquery加密货币数据分析
加密资产的波动性使得数据在决定区块链市场状态方面与黄金一样有价值。这就是 Bitquery 将你从数据地狱中解救出来并使其变得非常容易使用的地方。
一键发币: SOL | BNB | ETH | BASE | Blast | ARB | OP | POLYGON | AVAX | FTM | OK
加密资产的波动性使得数据在决定区块链市场状态方面与黄金一样有价值。
这就是 Bitquery 将你从数据地狱中解救出来并使其变得非常容易使用的地方。
在这里,我们将构建一个迷你项目,可视化以太坊主网上可用的多个代币的唯一地址量。
假设:你已经注册了 Bitquery(如果还没有,请单击此处)
1、Bitquery 浏览器和 API
Bitquery Explorer 是实时或存档区块链数据的天堂。
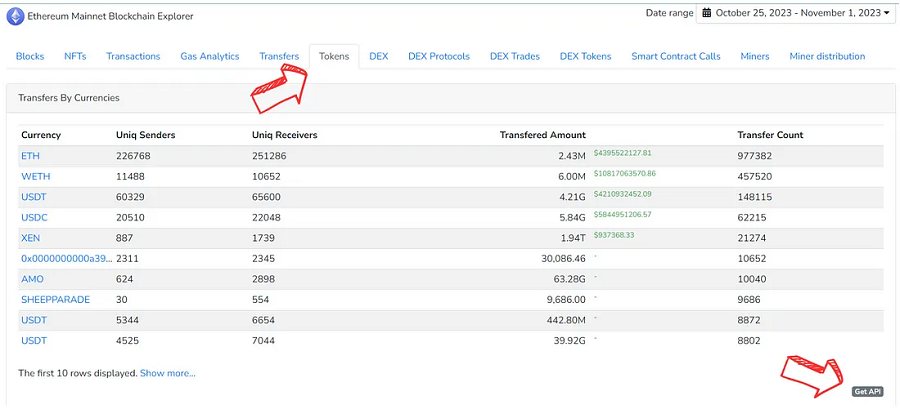
选择以太坊主网,进入“代币”部分以发现预先开发的统计数据,然后单击“获取 API”按钮重定向到 IDE,可以在其中根据你的数据要求进行查询。
2、使用 GraphQL IDE
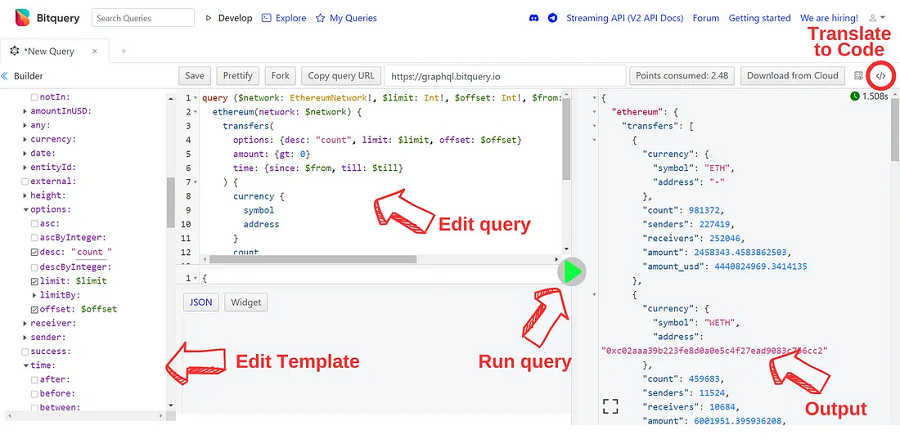
分解:
- 编辑模板:选择要从区块链数据池中查询的属性。
- 编辑查询:系统会根据您选择的道具自动创建查询,以便您也可以根据需要对它们进行硬编码。
- 运行查询:运行查询。
- 输出:您的查询或错误的结果将显示在这里。
- 翻译为代码:您可以将给定的查询翻译为任何流行的编程语言,以将其合并到您的项目中。
我们将在此项目中使用 Python 和 Jupyter Notebook。
单击 </> 按钮并选择“Python - http.client”以生成预制代码以查询以太坊主网上选定的加密货币数据。
3、导入库
import http.client
import json
import pandas as pd
import numpy as np
import matplotlib.pyplot as plt
4、使用 API 检索数据
要在登录后查找你的 API 密钥,请转到个人资料部分。
#establishing a connection
conn = http.client.HTTPSConnection("graphql.bitquery.io")
payload = json.dumps({
   "query": "query ($network: EthereumNetwork!, $limit: Int!, $offset: Int!, $from: ISO8601DateTime, $till: ISO8601DateTime) {\n  ethereum(network: $network) {\n    transfers(\n      options: {desc: \"count\", limit: $limit, offset: $offset}\n      amount: {gt: 0}\n      time: {since: $from, till: $till}\n    ) {\n      currency {\n        symbol\n        address\n      }\n      count\n      senders: count(uniq: senders)\n      receivers: count(uniq: receivers)\n      amount\n      amount_usd: amount(in: USD)\n    }\n  }\n}\n",
   "variables": "{\n  \"limit\": 100,\n  \"offset\": 10,\n  \"network\": \"ethereum\",\n  \"from\": \"2023-10-31T20:01:02.000Z\",\n  \"till\": \"2023-11-01T20:01:02.999Z\",\n  \"dateFormat\": \"%Y-%m-%d\"\n}"
})

#make sure to add you API key in the X_API_KEY otherwise the code won't work
headers = {
   'Content-Type': 'application/json',
   'X-API-KEY': 'YOUR_API_KEY'
}

#posting the request to the API endpoint
conn.request("POST", "/", payload, headers)
res = conn.getresponse()
data = res.read()
response= json.loads(data.decode("utf-8"))

#generating a data frame for the retrieved data
data_table= response["data"]["ethereum"]["transfers"]
dataframe = pd.json_normalize(data_table)
print(dataframe)
运行此代码将为你提供 7 列,如下所示:
- 转账次数
- 唯一发件人
- 唯一接收人
- 转账金额
- 美元转账金额
- 货币符号
- 币种地址
你可以从这些列中推断出多组见解。 在这个项目中,我们将仅关注发送者和接收者的地址。 让我们对这些数据进行切片并删除任何不必要的条目以继续进行数据可视化。
5、数据预处理
df = dataframe.head(10)
df.drop(df.index[(df['currency.symbol'] == "????")],axis=0,inplace=True)
symbol = df['currency.symbol']
senders = df["senders"]
receivers = df["receivers"]
6、数据可视化
使用 Matplotlib 库创建简单的条形图,并探索各种加密货币的发送者和接收者数量如何变化。
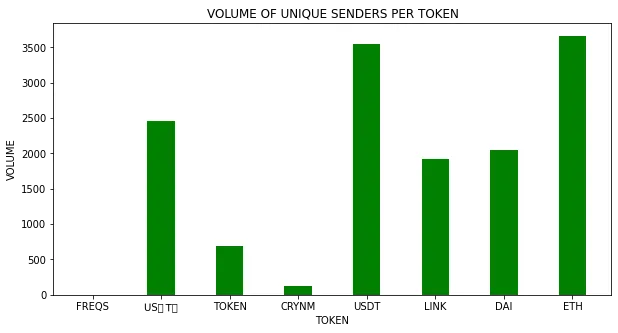
#display volume of unique addresses of senders
fig = plt.figure(figsize=(10,5))
plt.bar(symbol, senders, color='green', width=0.4)
plt.xlabel('TOKEN')
plt.ylabel('VOLUME')
plt.title("VOLUME OF UNIQUE SENDERS PER TOKEN")
plt.show()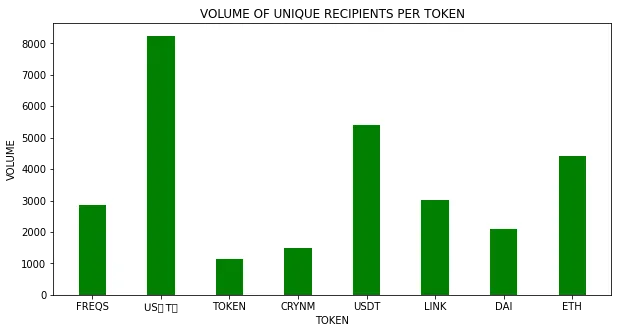
#display volume of unique addresses of recipients
fig = plt.figure(figsize=(10,5))
plt.bar(symbol, receivers, color='green', width=0.4)
plt.xlabel('TOKEN')
plt.ylabel('VOLUME')
plt.title("VOLUME OF UNIQUE RECIPIENTS PER TOKEN")
plt.show()
7、结束语
这是一个迷你项目,用于描述如何利用 Bitquery Explorer 和 API 快速创建有关不同区块链数据的富有洞察力的视觉效果,无论是实时数据还是存档数据。
除了此处描述的少数工具之外,Bitquery 还通过 API 提供了大量预先编写的代码,同时你还可以“探索”其他开发人员创建的查询,这可能会节省你在 IDE 重定向方面的时间。
原文链接:How to use Bitquery Explorer and API for Cryptocurrency Data Analysis (ft. Jupyter Notebook)
DefiPlot翻译整理,转载请标明出处